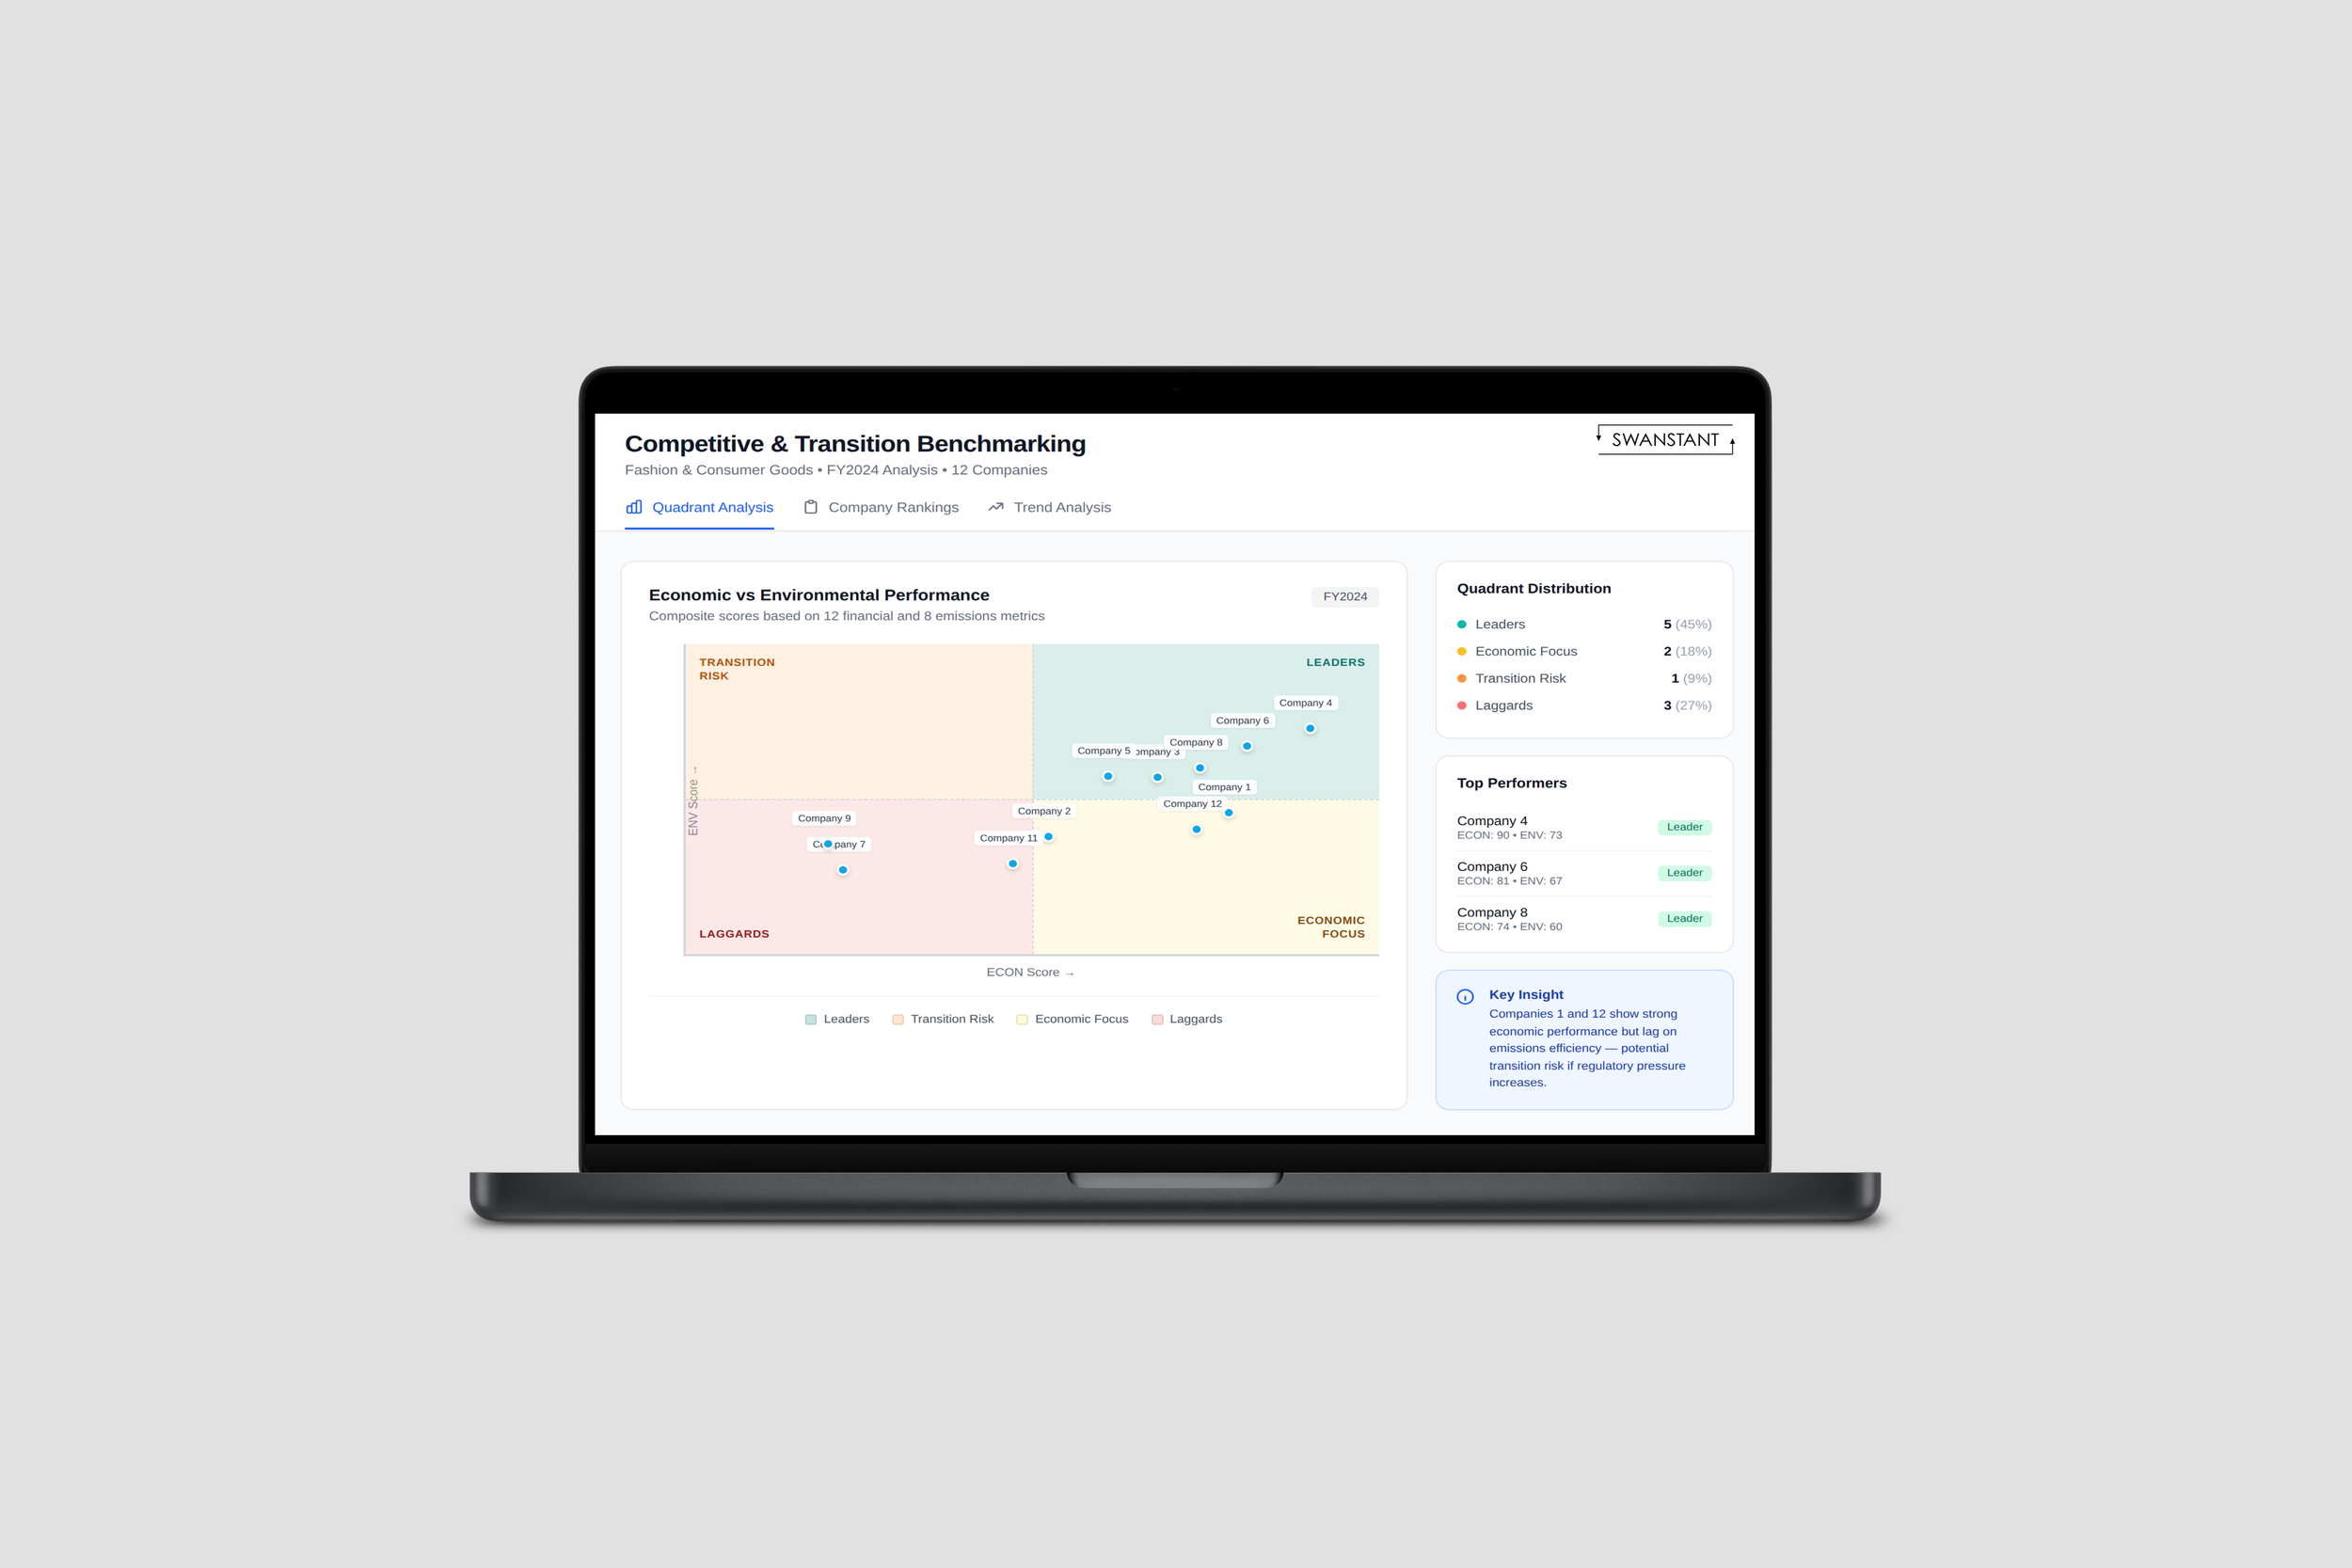
Competitive & Transition Benchmarking
IllustrativeWe provide an independent, comparable view of performance, valuation context, and transition efficiency – so leaders can see where they stand, what is changing, and where risks or advantages are forming.
The output is built for strategy and resource allocation, not reporting.
Annual Benchmarking Report: Sector benchmarks and performance trends, with optional company-level deep dives and detailed competitor comparisons.
Ongoing Intelligence Partnership: A lightweight quarterly or bi-annual refresh (aligned with disclosure cycles) that keeps benchmarking current and flags early signals as conditions shift.
Two ways to engage
What we track
Competitive positioning: growth quality, margin durability, and competitive trajectory
Resilience signals: behaviour through market volatility and competitive pressure
Transition efficiency: emissions intensity, decarbonisation momentum, and trajectory
Valuation context: market expectations vs fundamentals (e.g., premium compression, multiple shifts)
Our composite indicators combine financial and environmental signals to surface inflection points and emerging divergences across peers and time. Built on a curated, growing cross-sector dataset of leading public companies, complemented by selective private benchmarks where reliable data is available.
Partnerships start with a clear core view, with optional deep dives on environmental leadership durability, and competitive gap trajectories – tracked consistently over time.
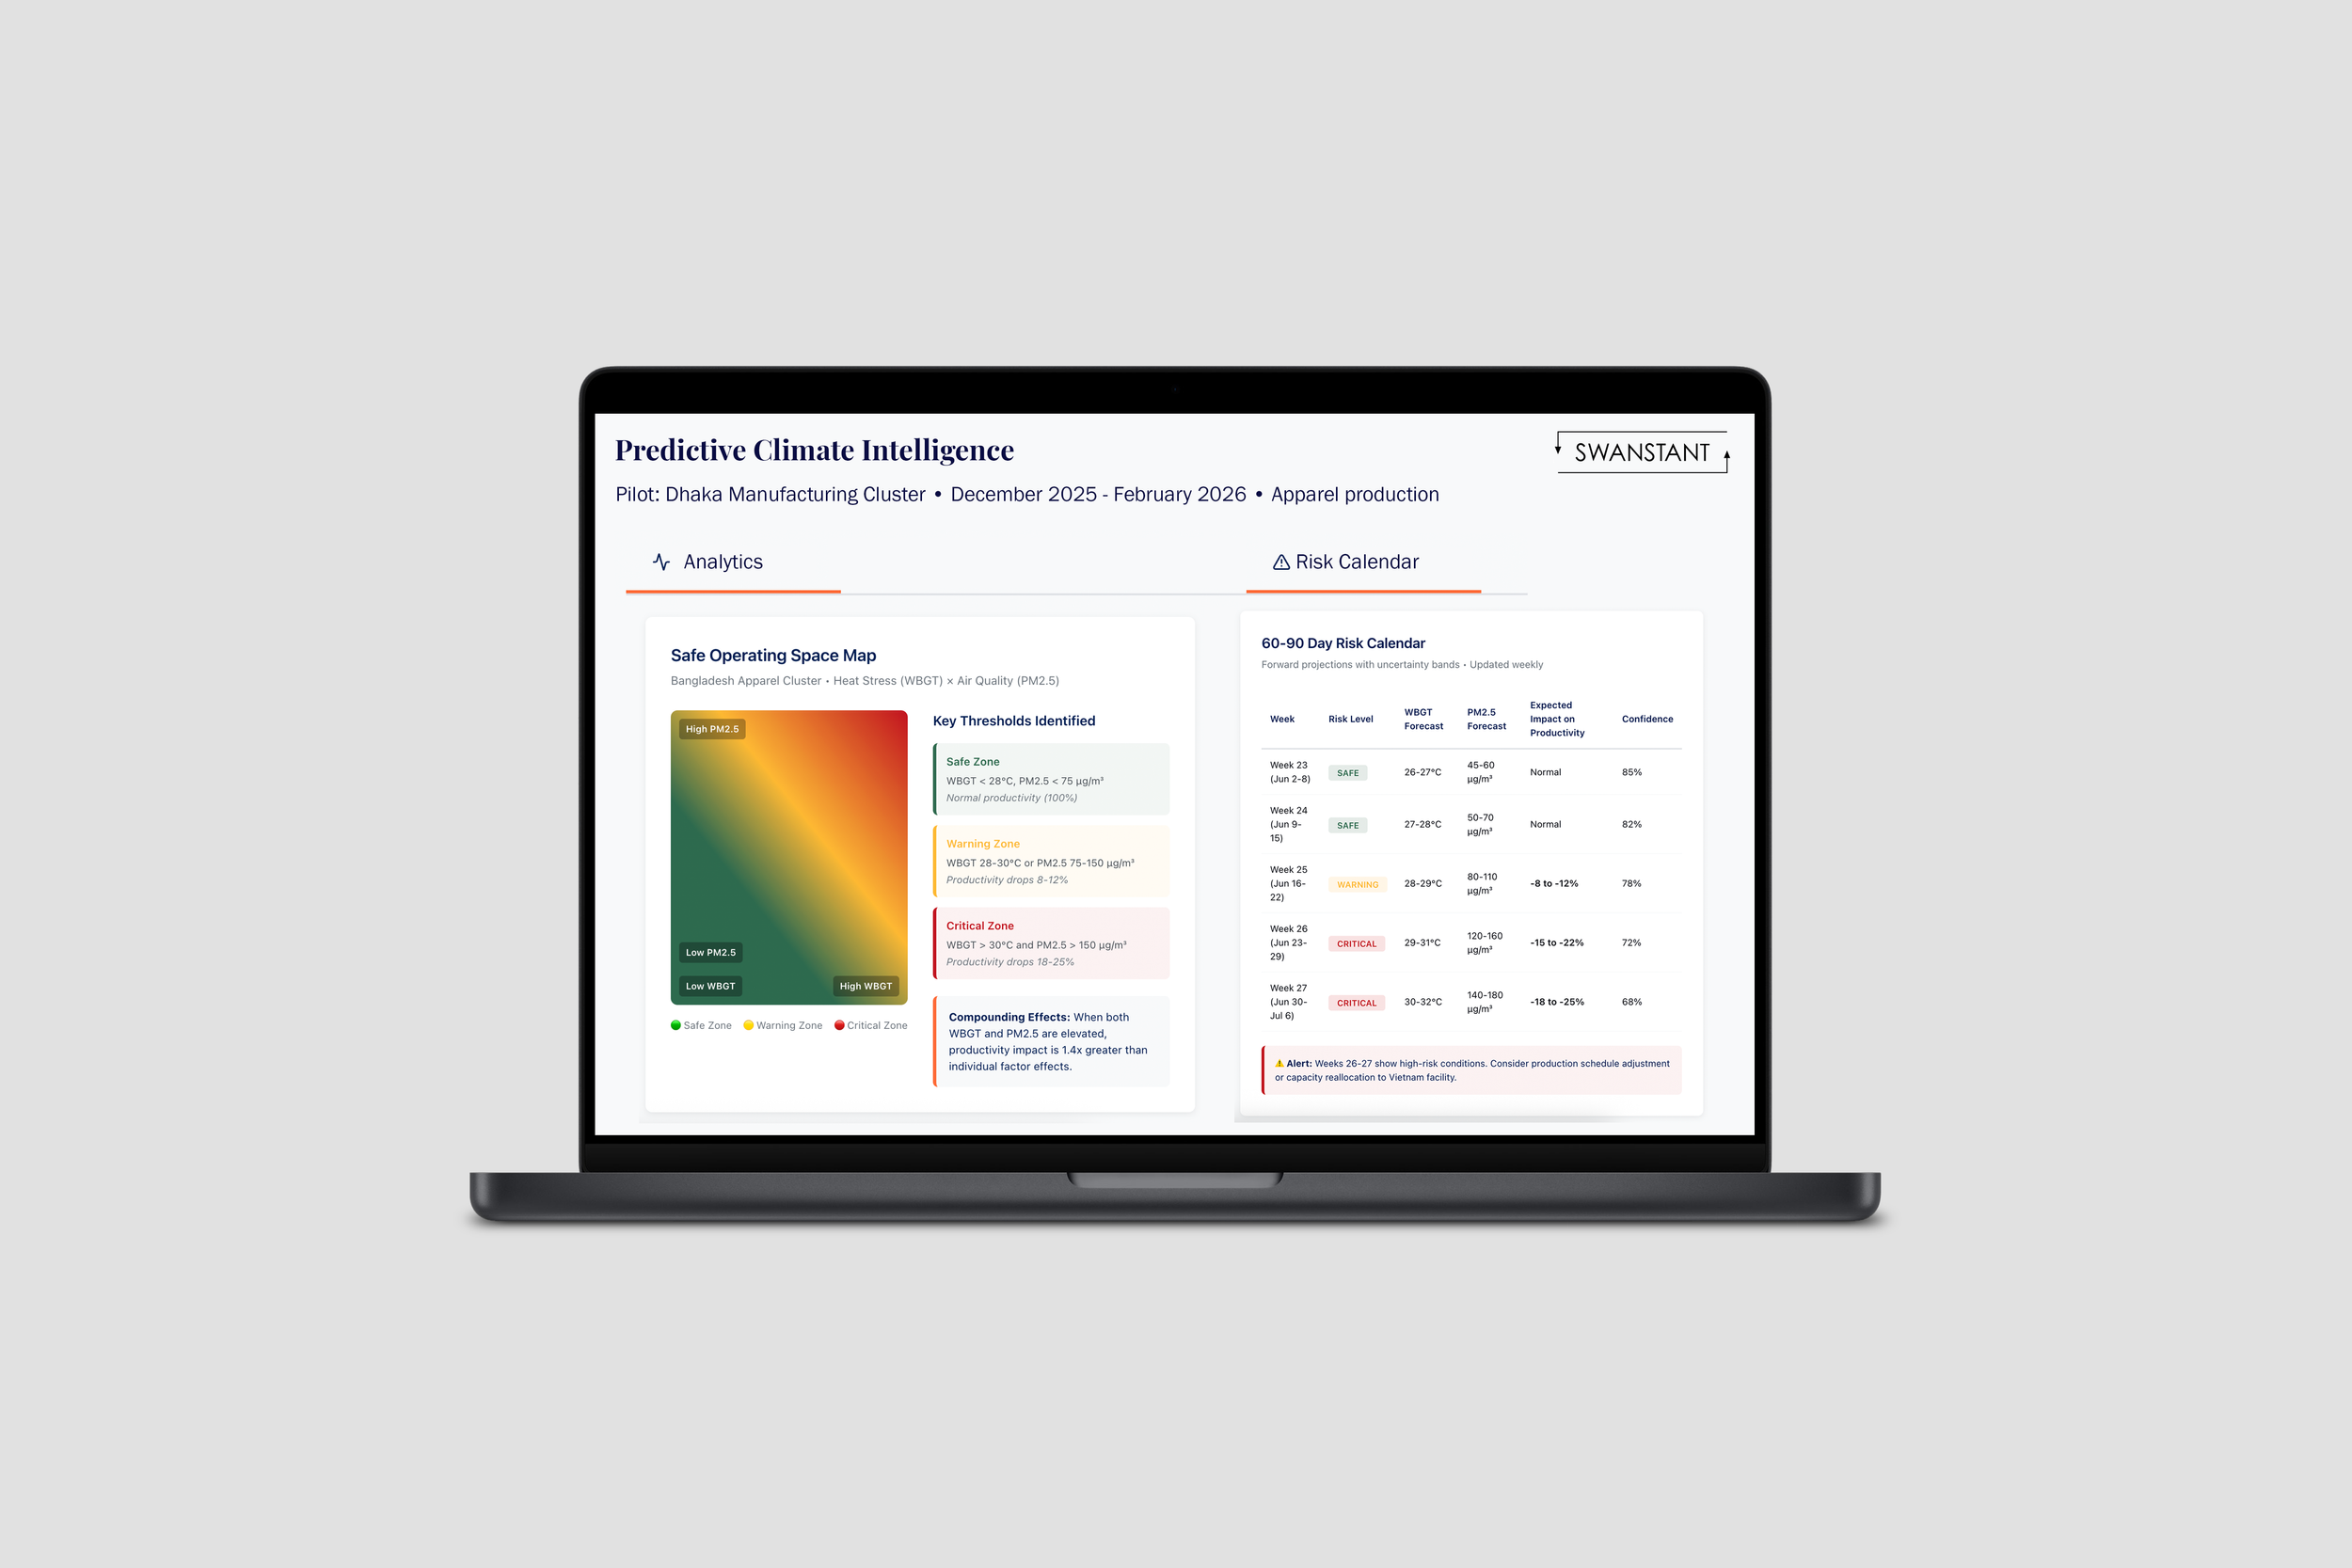
Predictive Climate Intelligence (PCI)
IllustrativePCI turns climate and macro signals into near-term operational and financial foresight, so leaders can anticipate the potential impact of disruption and act early rather than react. It is designed for sourcing, production, and inventory decisions (weeks to months), not long-horizon scenario planning.
Discovery Workshop (2–3 hours): Map your key vulnerabilities, identify highest-impact use cases, and assess data readiness.
Proof-of-Value Pilot (8–10 weeks): Test one module on a live decision window and quantify decision value with outputs you can scale if useful.
Two ways to get started
Materials (up to 6 months): climate-sensitive risks to production, yield/quality for critical inputs, before price signals fully show.
Manufacturing (60–90 days): early warnings when environmental conditions are likely to cross productivity/quality thresholds in key clusters or factories.
Demand / Retail (60–90 days): category-level demand shifts driven by climate and macro conditions to support allocation, replenishment, and markdown timing.
What PCI covers
Safe-operating-space map: where productivity/quality/demand is stable, and where it deteriorates.
Co-developed resilience playbook: triggers, actions, owners, and timing aligned to your planning/escalation process.
60–90-day projections with uncertainty bands, plus a post-event estimate of value protected.
What you get from a pilot
PCI is a new engine. We are actively looking for a very limited number of strategic partners to help shape it:
First-mover edge: apply PCI before peers and turn volatility into a planning advantage.
Evidence, not promises: measurable outputs on a real decision window, vs a baseline.
Shape the product: tailor thresholds, drivers, and playbooks to your operational reality.
Low-risk partnership: focused scope; pilot conditions reflect proof-of-concept stage and shared uncertainty.
Why pilot with us now
In MVP tests (Nov 2025), PCI achieved 71% six-month directional accuracy for natural rubber production in Indonesia and 81% one-month directional accuracy* for apparel production in Indonesia. Results were achieved with monthly national aggregates and we expect performance to improve as we add granularity and calibrate to new contexts.
*Directional accuracy = sign of change
Early validation
They trust us