

Climate-economic intelligence that shows leaders where they stand – and anticipates disruption ahead.
Swanstant connects climate, emissions, and macro signals to financial performance and operational resilience so teams can allocate resources and act before disruption hits.

What we do:
Predictive Climate Intelligence: Translate climate and macro signals into 1–6 month operational and financial foresight. Act early with dedicated playbooks to protect COGS, OTIF, and margins.
MVP validation on natural rubber production in Indonesia achieved 71% six-month directional accuracy. Enough lead time to act early, rather than react.
2026 Competitive & Transition Benchmark - Now Available
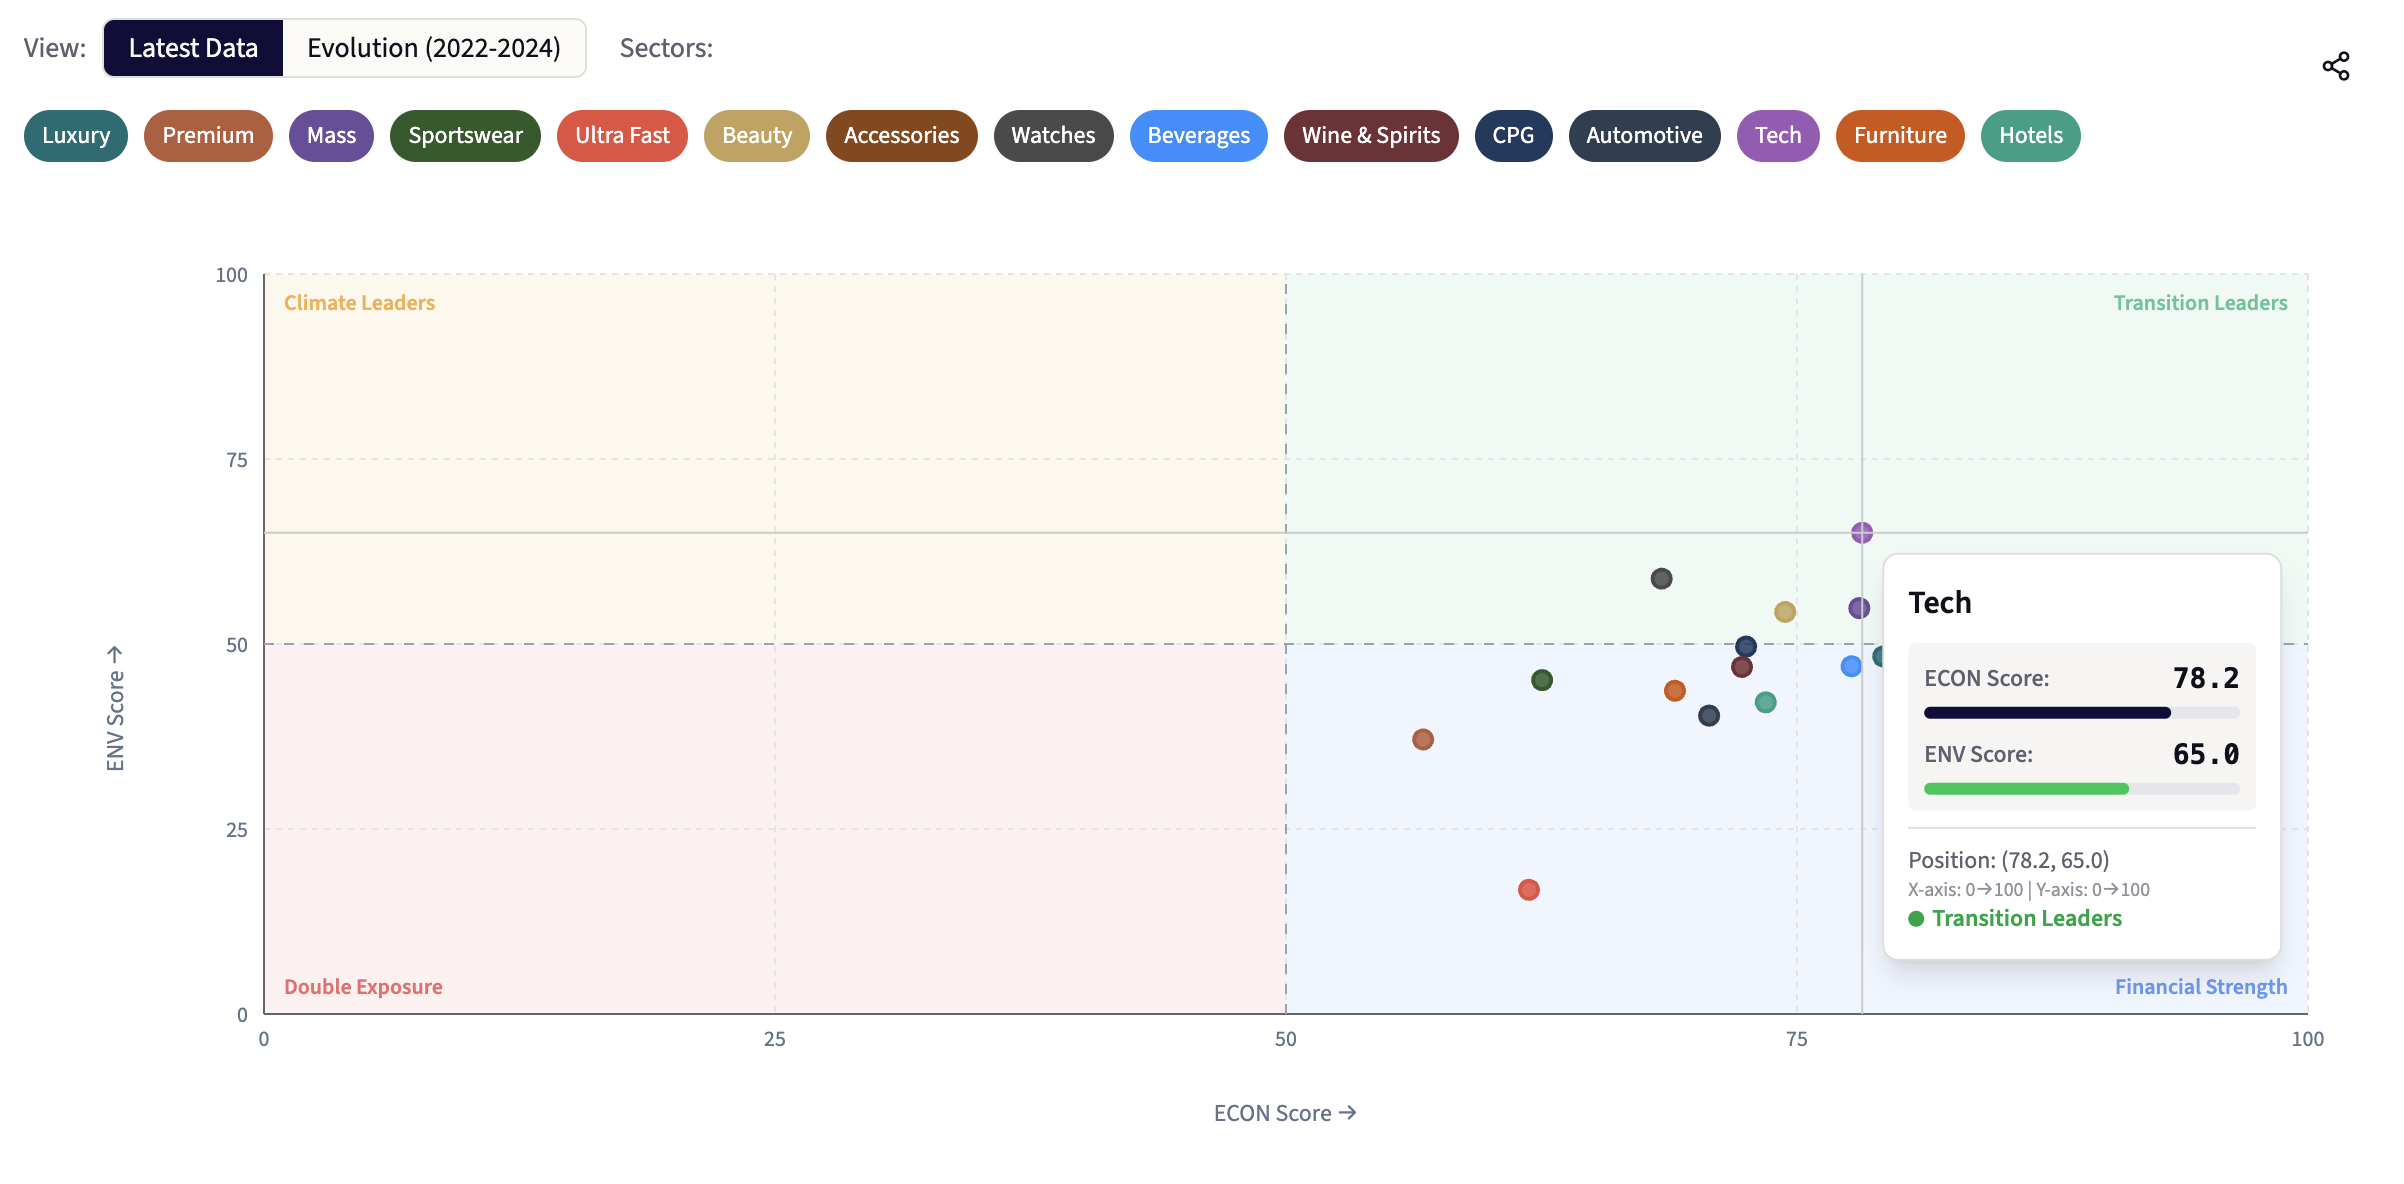
Expanded coverage. New indicators for sharper peer comparability. Individual company benchmarks introduced for the first time.
Check-out our 2026 Competitive & Transition Benchmark.

Our Weekly Newsletter
Climate on the Ledger
A weekly brief on the climate signals affecting operations, supply chains, and the P&L, including disruptions, costs, insurance/finance implications, and what resilience looks like in practice.